Wednesday 16 May 2012

TRIAL WITH THE INVERT THEME COLOUR


The invert result is great, but to me it works more well with the other tones. It's felt more deeper with white stars. But this is still a good result.

SCREENSHOTS OF PROJECT 2


I chose black and white because of it provides more contrast than any colours, the outcome is magnificent.

Submission 242 - Project 2

Here is my final submission for Project 2

CODE
-------------------------------------------------------------------------------------------------------------------------------------

import math

XRES = 900 ##WIDTH is 900
YRES = 700 ##HEIGHT is 700
centerX = random(XRES/2-200,XRES-200) ##Center of the planet (random between the middle of the sketch to 200 units around)
centerY = random(YRES/2-200,YRES-200)

def setup(): ##Setup sketch
size(XRES, YRES)
background(0) ##Black BG
noStroke()
fill(255,255,255,80) ##White colour, 80 alpha
smooth()

randata = [] ##list randata
for i in range(XRES): ##size of the circle random
randata = randata + [random(-150.,150.)]

def plot(data, yoff): ##Star Contributor : random in a circle
for i in range(1, XRES):
angle = random(0.,PI*2)
x = i*1.618*sin(angle) ##golden ratio applied
y = i*1.618*cos(angle)
ellipse(centerX+x,centerY+y,data[i]/5,data[i]/5) ##main circles make the galaxy
ellipse(centerX+2*x,centerY+2*y,data[i]/7,data[i]/7) ##smaller circles make it more interesting

def filter(data):
for i in range(1,XRES-1):
data[i]=0.5*(data[i-1] + data[i+1]) ##Median filter for data

def draw():
filter(randata)
if (4*frameCount)<(2500): ##the amount of circles and speed of the sketch
plot(randata, 4*frameCount)
-------------------------------------------------------------------------------------------------------------------------------------

MORE TRIALS TO GET MORE INTERESTING

From the previous trial with circles, I found it was very interesting to create something like a huge system like the underwater world with bubbles or.... maybe a galaxy. Yeah, should do it.

Comment : Tried with the alpha on black colours to blend out the circles, also applied one more ellipse function to draw the ring around a specific center. The outcome is magnificent, looked so much like a galaxy with a big planet at the center.
CODE :
------------------------------------------------------------------------------------------------------------------
 import math

XRES = 600
YRES = 400
centerX = random(XRES/2,XRES)
centerY = random(YRES/2,YRES)

def setup():
    size(XRES, YRES)
    background(255)
    noStroke()
    fill(0,0,0,80)
    smooth()
  
randata = []
for i in range(XRES):
    randata = randata + [random(-100.,100.)]
  
def plot(data, yoff):
    for i in range(1, XRES):
        angle = random(0.,PI*2)
        x = i*1.618*sin(angle)
        y = i*1.618*cos(angle)
        ellipse(centerX+x,centerY+y,data[i]/4,data[i]/4)
      
def filter(data):
    for i in range(1,XRES-1):
        data[i]=0.5*(data[i-1] + data[i+1])
                          
      
def draw():
    filter(randata)
    if (2*frameCount)<(800):
        plot(randata, 2*frameCount)
------------------------------------------------------------------------------------------------------------------

Now I was trying with more frameCount to get more circles, so I cranked it up into 2000 instead of 800. The number would cause a crash though, but would worth a try as well .

Comment : The outcome is great, but I thought it was a bit too off focus there. The black took lots of spaces, made it look like a black hole rather than a galaxy. Also to point out the tiny circles, I tried to tweak a little bit with the second "ellipse" function to get much smaller stars.

CODE :
------------------------------------------------------------------------------------------------------------------
 import math

XRES = 600
YRES = 400
centerX = random(XRES/2,XRES-200)
centerY = random(YRES/2,YRES-200)

def setup():
    size(XRES, YRES)
    background(255)
    noStroke()
    fill(0,0,0,80)
    smooth()
  
randata = []
for i in range(XRES):
    randata = randata + [random(-150.,150.)]
  
def plot(data, yoff):
    for i in range(1, XRES):
        angle = random(0.,PI*2)
        x = i*1.618*sin(angle)
        y = i*1.618*cos(angle)
        ellipse(centerX+x,centerY+y,data[i]/4,data[i]/4)
        ellipse(centerX+2*x,centerY+2*y,data[i]/4,data[i]/4)
      
def filter(data):
    for i in range(1,XRES-1):
        data[i]=0.5*(data[i-1] + data[i+1])
                          
      
def draw():
    filter(randata)
    if (2*frameCount)<(2000):
        plot(randata, 2*frameCount)
------------------------------------------------------------------------------------------------------------------

I thought I should have gone back a bit with the amount of circles as well as the radius.
Comment : Much smaller black center, the rings out side is clearly shaped. The outcome is awesome, I like it.

CODE :
------------------------------------------------------------------------------------------------------------------
 import math

XRES = 600
YRES = 400
centerX = random(XRES/2,XRES-200)
centerY = random(YRES/2,YRES-200)

def setup():
    size(XRES, YRES)
    background(255)
    noStroke()
    fill(0,0,0,80)
    smooth()
  
randata = []
for i in range(XRES):
    randata = randata + [random(-150.,150.)]
  
def plot(data, yoff):
    for i in range(1, XRES):
        angle = random(0.,PI*2)
        x = i*1.618*sin(angle)
        y = i*1.618*cos(angle)
        ellipse(centerX+x,centerY+y,data[i]/5,data[i]/5)
        ellipse(centerX+2*x,centerY+2*y,data[i]/7,data[i]/7)
      
def filter(data):
    for i in range(1,XRES-1):
        data[i]=0.5*(data[i-1] + data[i+1])
                      
      
def draw():
    filter(randata)
    if (4*frameCount)<(2000):
        plot(randata, 4*frameCount)
------------------------------------------------------------------------------------------------------------------ 

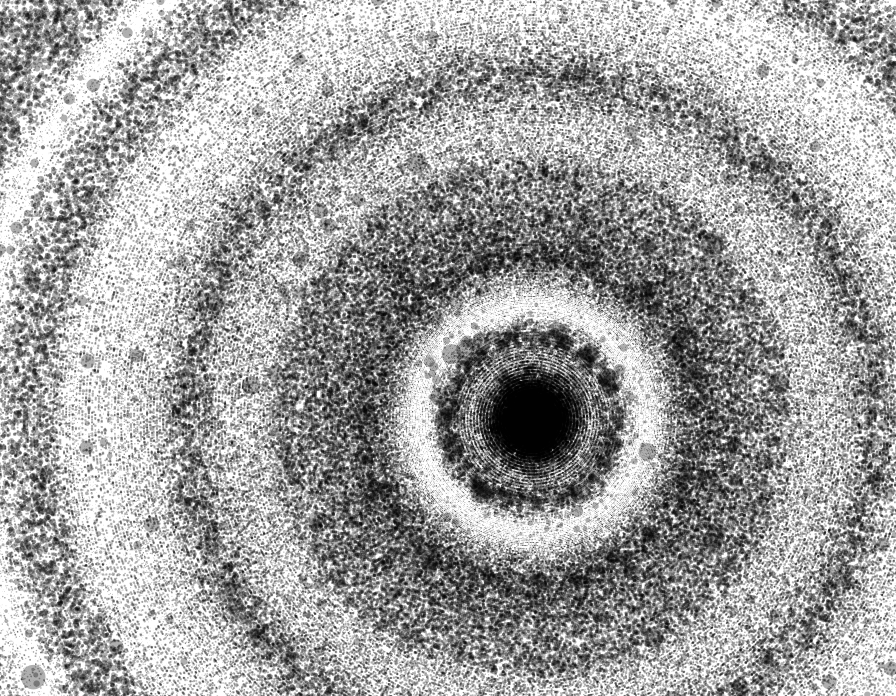
I just found the problem I got here was the center of my galaxy just randomly placed to the right of the sketch. So I tried to figure out the way to make this right. Putting a negative number in the random in the sketch would help. Also I tweaked the size of the sketch to get more stars in a sketch, I thought it would be more interesting though.

Comment : The ring is random as well. However the ring is pleasure to me already.

CODE :
------------------------------------------------------------------------------------------------------------------
 import math

XRES = 900
YRES = 700
centerX = random(XRES/2,XRES-200)
centerY = random(YRES/2,YRES-200)

def setup():
    size(XRES, YRES)
    background(255)
    noStroke()
    fill(0,0,0,80)
    smooth()
  
randata = []
for i in range(XRES):
    randata = randata + [random(-150.,150.)]
  
def plot(data, yoff):
    for i in range(1, XRES):
        angle = random(0.,PI*2)
        x = i*1.618*sin(angle)
        y = i*1.618*cos(angle)
        ellipse(centerX+x,centerY+y,data[i]/5,data[i]/5)
        ellipse(centerX+2*x,centerY+2*y,data[i]/7,data[i]/7)
      
def filter(data):
    for i in range(1,XRES-1):
        data[i]=0.5*(data[i-1] + data[i+1])
                          
      
def draw():
    filter(randata)
    if (4*frameCount)<(2500):
        plot(randata, 4*frameCount)
------------------------------------------------------------------------------------------------------------------

TRIALS WITH HARDER FILTER AND RANDOM IN CIRCLE

I stepped one more step to more complicated codes like random in circle and more advanced filtered random.

 Comment : The outcome is great, so random and fulfill. More interesting with these codes.
CODE :
------------------------------------------------------------------------------------------------------------------
import math

XRES = 600
YRES = 400
centerX = XRES/2
centerY = YRES/2
npts = 400

def setup():
    size(XRES, YRES)
    background(255)
    stroke(0)
    smooth()
   
randata = []
for i in range(XRES):
    randata = randata + [random(-100.,100.)]
   
def plot(data, yoff):
    for i in range(1, XRES):
        angle = PI*2
        x = i*1.618*sin(angle)
        y = i*1.618*cos(angle)
        line(x,y,i,yoff+data[i])
       
def filter(data):
    for i in range(1,XRES-1):
        data[i]=0.9*(data[i-1] + data[i+1])
                           
       
def draw():
    filter(randata)
    if (40*frameCount)<(YRES+200):
        plot(randata, 40*frameCount)
------------------------------------------------------------------------------------------------------------------

Then I tried smaller amount on filtering like (0.5-0.6) the multiply the frameCount with 50.
 Comment : The outcome is much crazier. The lines are filling all the blank on the sketch, and making really crazy net.
CODE :
------------------------------------------------------------------------------------------------------------------
 import math

XRES = 600
YRES = 400
centerX = XRES/2
centerY = YRES/2
npts = 400

def setup():
    size(XRES, YRES)
    background(255)
    stroke(0)
    smooth()
  
randata = []
for i in range(XRES):
    randata = randata + [random(-100.,100.)]
  
def plot(data, yoff):
    for i in range(1, XRES):
        angle = random(0.,PI*2)
        x = i*1.618*sin(angle)
        y = i*1.618*cos(angle)
        line(centerX+x,centerY+y,i/250,yoff+data[i])
      
def filter(data):
    for i in range(1,XRES-1):
        data[i]=0.5*(data[i-1] + data[i+1])
                      
      
def draw():
    filter(randata)
    if (50*frameCount)<(YRES+200):
        plot(randata, 50*frameCount)
------------------------------------------------------------------------------------------------------------------

The previous trial was crazy, but that with lines I wonder why not using ellipse shapes?
 Comment : This is an amazing outcome. Circles by circles, somehow I felt like I was 10k feet under the water where lots of bubbles surrounding me.
CODE :
------------------------------------------------------------------------------------------------------------------
 import math

XRES = 600
YRES = 400
centerX = XRES/2
centerY = YRES/2
npts = 400

def setup():
    size(XRES, YRES)
    background(255)
    stroke(0)
    smooth()
  
randata = []
for i in range(XRES):
    randata = randata + [random(-100.,100.)]
  
def plot(data, yoff):
    for i in range(1, XRES):
        angle = random(0.,PI*2)
        x = i*1.618*sin(angle)
        y = i*1.618*cos(angle)
        ellipse(centerX+x,centerY+y,data[i],data[i])
      
def filter(data):
    for i in range(1,XRES-1):
        data[i]=0.5*(data[i-1] + data[i+1])
                      
      
def draw():
    filter(randata)
    if (50*frameCount)<(YRES+200):
        plot(randata, 50*frameCount)
------------------------------------------------------------------------------------------------------------------

MORE UNDERSTANDING ON CODES

I got some ideas how these codes works, so I started to tweak as my pleasant.
At the very first, I tried with filtered random, tried to fix some numbers to get more interesting results.

 Comment :  Crazy waves caused from filter and random. Interesting.
CODE :
------------------------------------------------------------------------------------------------------------------
XRES = 600
YRES = 400

def setup():
    size(XRES, YRES)
    background(255)
    stroke(0)
    smooth()
   
randata = []
for i in range(XRES):
    randata = randata + [random(-50.,150.)]
   
def plot(data, yoff):
    for i in range(1, XRES):
        line(i-1,yoff+data[i-1],i,yoff+data[i])
       
def filter(data):
    for i in range(1,XRES-1):
        data[i]=0.5*(data[i-1] + data[i+1])
       
def draw():
    filter(randata)
    if (4*frameCount)<(YRES+100):
        plot(randata, 4*frameCount)
------------------------------------------------------------------------------------------------------------------

What if I tried with another shapes instead of using lines? Here with the circles
Comment : Looks crazy, I love this.
 CODE :
------------------------------------------------------------------------------------------------------------------
 XRES = 600
YRES = 400

def setup():
    size(XRES, YRES)
    background(255)
    stroke(0)
    smooth()
  
randata = []
for i in range(XRES):
    randata = randata + [random(-200.,200.)]
  
def plot(data, yoff):
    for i in range(1, XRES):
        ellipse(i-1,yoff+data[i-1],i,yoff+data[i])
      
def filter(data):
    for i in range(1,XRES-1):
        data[i]=0.5*(data[i-1] + data[i+1])
                          
      
def draw():
    filter(randata)
    if (40*frameCount)<(YRES+100):
        plot(randata, 40*frameCount)
------------------------------------------------------------------------------------------------------------------
And trial with rectangle

Comment : Hierarchy indeed, but not my types of art. Good trial to understand more on codes though.
CODE :
------------------------------------------------------------------------------------------------------------------
 XRES = 600
YRES = 400

def setup():
    size(XRES, YRES)
    background(255)
    stroke(0)
    smooth()
  
randata = []
for i in range(XRES):
    randata = randata + [random(-200.,200.)]
  
def plot(data, yoff):
    for i in range(1, XRES):
        rect(i-1,yoff+data[i-1],i,yoff+data[i])
      
def filter(data):
    for i in range(1,XRES-1):
        data[i]=0.5*(data[i-1] + data[i+1])
                      
      
def draw():
    filter(randata)
    if (40*frameCount)<(YRES+100):
        plot(randata, 40*frameCount)
------------------------------------------------------------------------------------------------------------------

EXAMPLES BY EXAMPLES

I was bit slow at understanding all of the random codes, so I tried almost the examples from the "random" lecture PDF files.
Example 1 :
Comment : In linear form, the simplest one.
CODE :
-----------------------------------------------------------------------------------------------------------------
XRES = 600
YRES = 600
CX = XRES/2
CY = YRES/2
npts = 5000

import math

def setup():
    size(XRES,YRES)
    background(255)
    stroke(0,10)
    smooth()
    noLoop()
   
def draw():
    for i in range(npts):
        r = CX + random(-200,200)
        line(r,CY-100,r,CY+100)
-----------------------------------------------------------------------------------------------------------------

Example 2 :
Comment : Just applied list in and get a slightly different result from the first one.
CODE :
-----------------------------------------------------------------------------------------------------------------
 XRES = 600
YRES = 600
CX = XRES/2
CY = YRES/2
npts = 5000

buckets = [0.]
buckets = buckets*XRES

def setup():
    size(XRES, YRES)
    background(255)
    stroke(0,10)
    smooth()
    noLoop()
  
def draw():
    for i in range(npts):
        r = CX + random(-200,200)
        line(r,CY-100,r,CY+100)
        ir = int(r)
        buckets[ir] = buckets[ir] + 1
      
    stroke(0)
    for i in range (XRES):
        line(i,CY-200,i,CY-200-buckets[i])
-----------------------------------------------------------------------------------------------------------------

Example 3 :
Comment : Still the same as the second one but with a gradient effect.
CODE :
-----------------------------------------------------------------------------------------------------------------
 XRES = 600
YRES = 600
CX = XRES/2
CY = YRES/2
npts = 5000

buckets = [0.]
buckets = buckets*XRES

def setup():
    size(XRES, YRES)
    background(255)
    stroke(0,10)
    smooth()
    noLoop()
  
def draw():
    for i in range(npts):
        r = CX
        for j in range(12): r = r + random(-50,50)
        line(r,CY-100,r,CY+100)
      
    stroke(0)
    for i in range(XRES):
        line(i, CY-200, i, CY-200-buckets[i])
-----------------------------------------------------------------------------------------------------------------